Introducing Glyphic: diagrams as data for LLMs and agents
Glyphic turns a typed JSON description of a diagram into a rendered SVG, PNG, and React Flow JSON —
across 18 diagram types, with no headless browser. You hand it nodes and edges (or entities,
commits, …) and get back a finished diagram. It's built for LLMs and agents: the model describes
what the diagram means, and a real engine decides where everything goes.
Here's why that split is the whole point.
Models can draw — until the diagram is real
Let's be honest, because the usual version of this pitch is out of date: a current frontier model can draw a small diagram as raw SVG. Aligned boxes, sensible arrows. If you need one throwaway picture, just ask it — that's the right tool.
The trouble starts the moment the diagram is real.
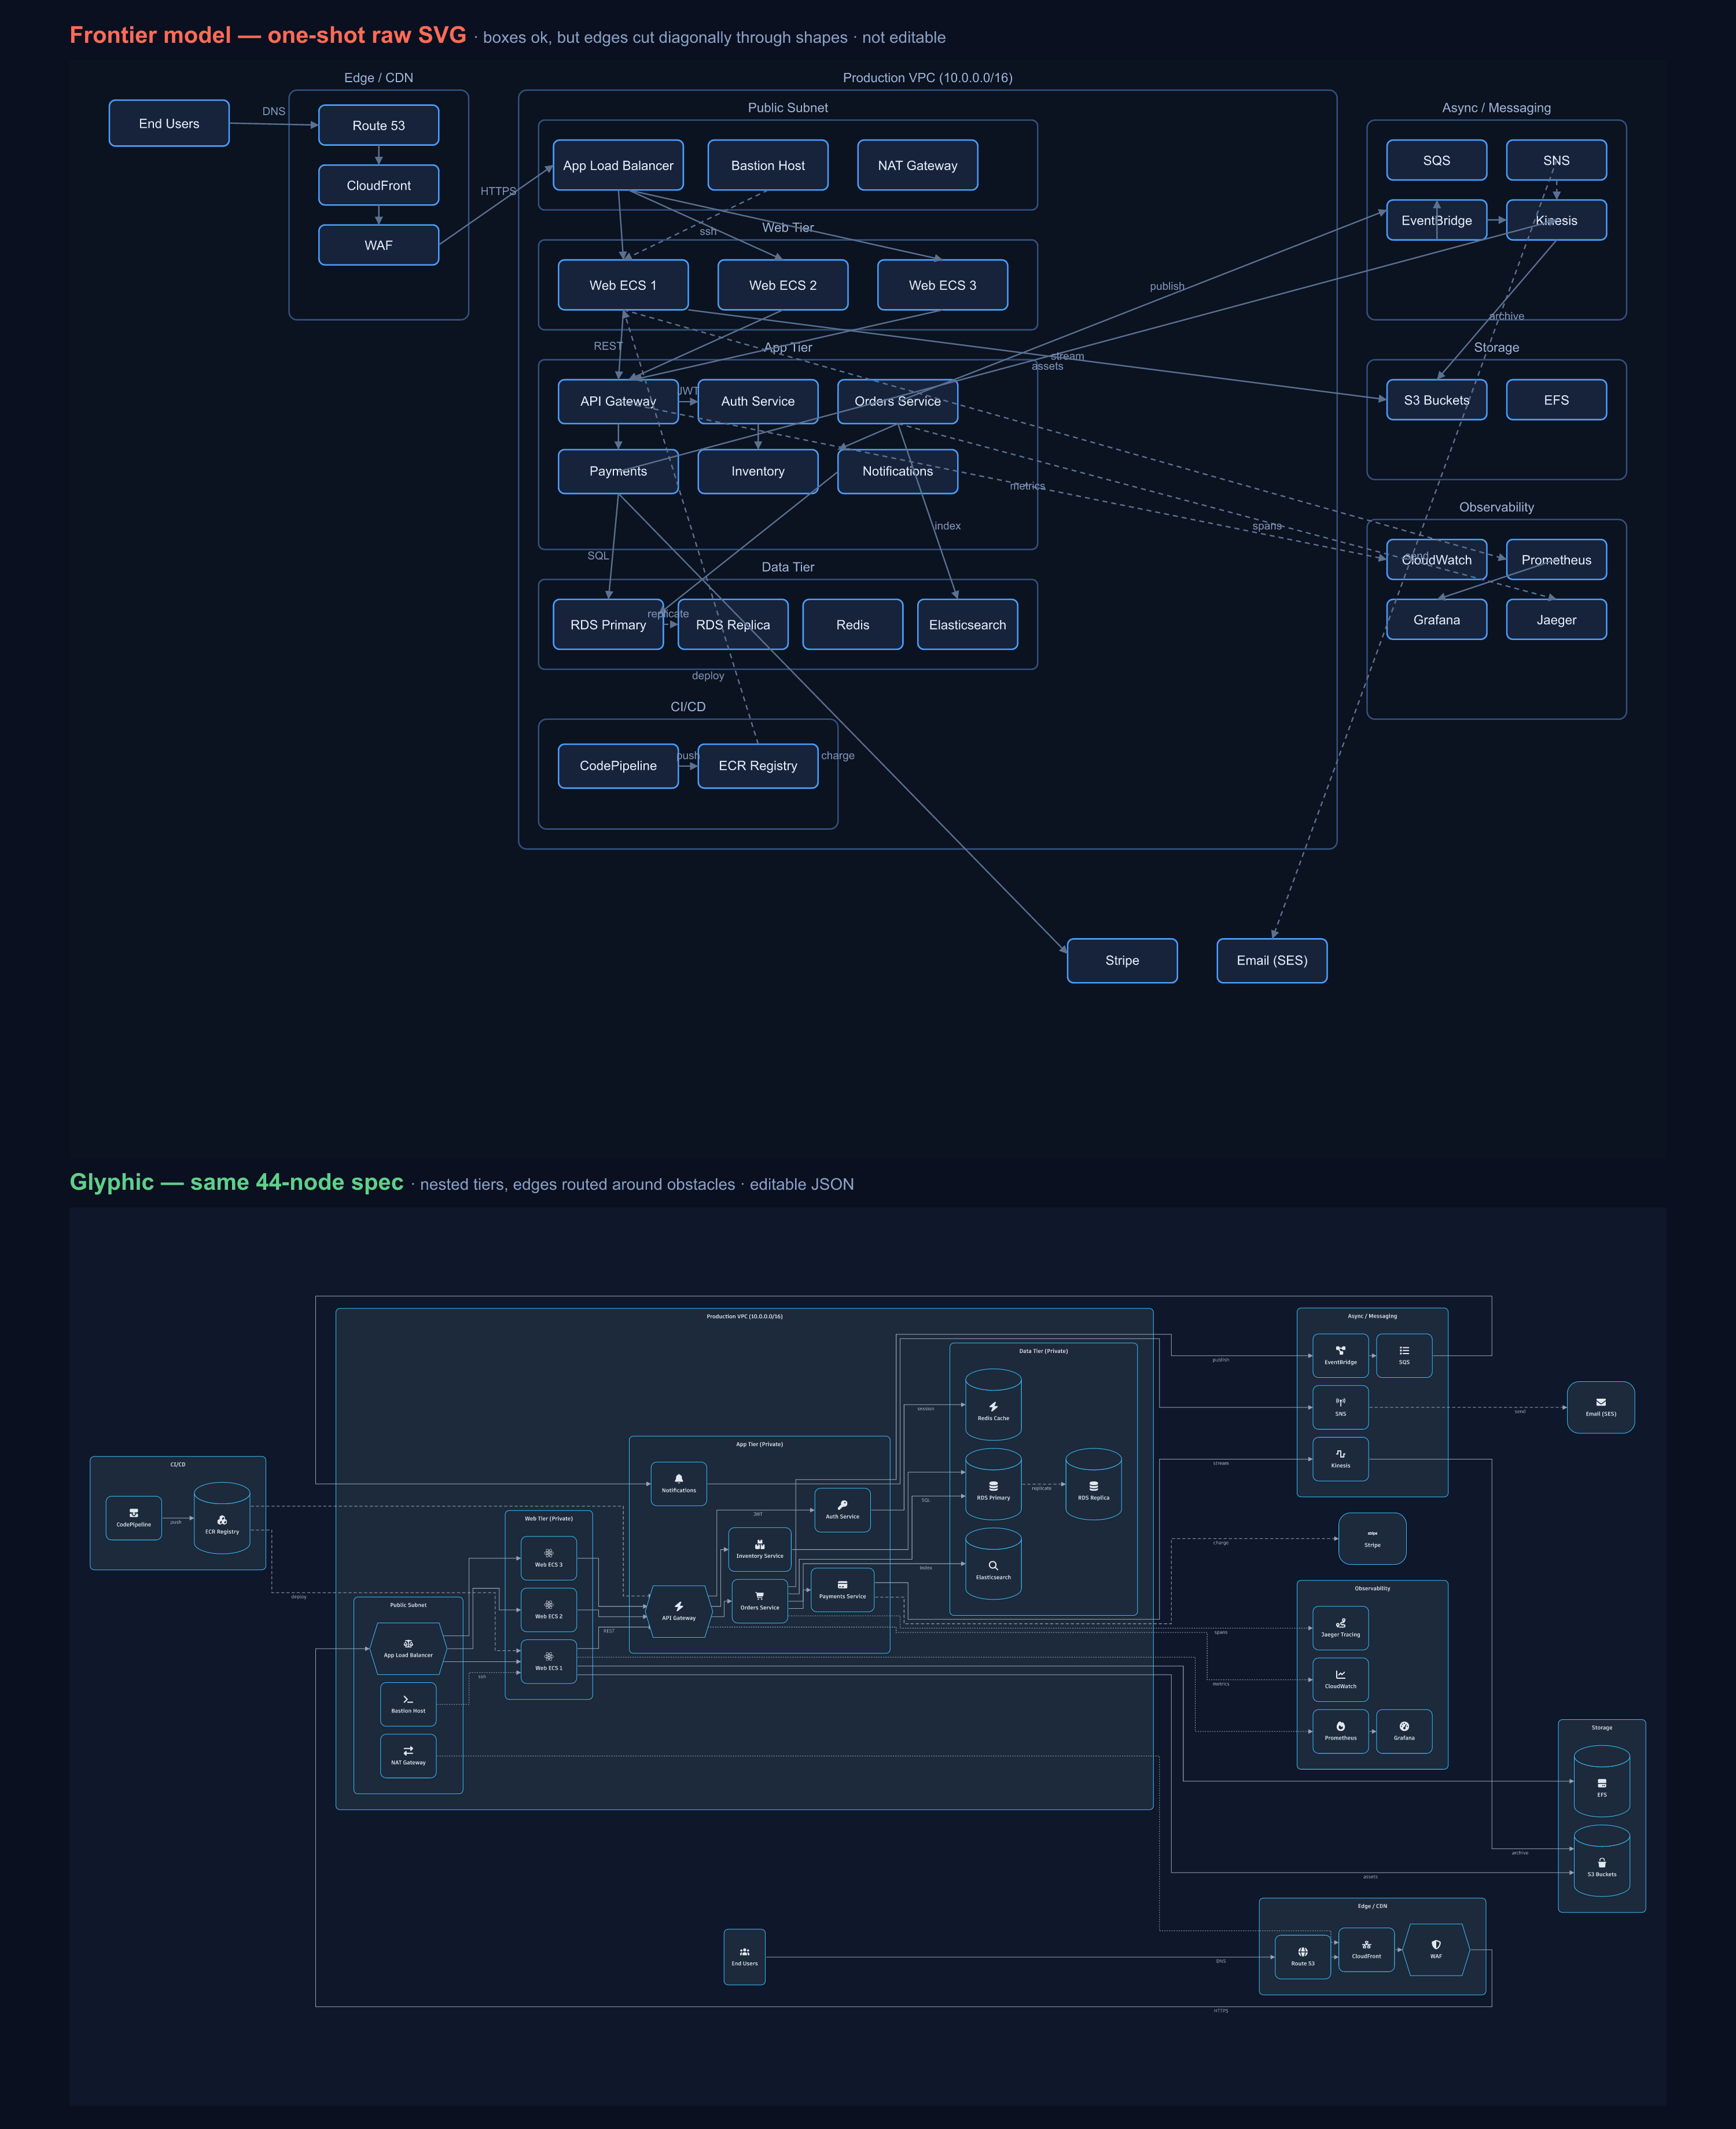
I gave one frontier model, in a single shot, a 44-node architecture — four nested tiers, 38 edges — and asked for raw SVG. Then I asked the same model to describe the same system as Glyphic JSON. The boxes were fine both ways. But the raw SVG's edges fell apart: with nowhere to route them, the model drew long diagonal lines straight through unrelated boxes. And when I changed one node, the entire hand-placed coordinate layout had to be regenerated — and came back different.
That's the real problem, and it isn't "the model can't see." A drawing is the wrong output type. A drawn SVG is a dead picture: non-reproducible, un-editable, and it breaks structurally at scale on the one part that isn't a language problem — routing edges around obstacles over a nested graph is global constraint optimization, not next-token prediction. A better model gives you nicer boxes, not untangled edges.
The idea: describe the meaning, let an engine do the layout
So Glyphic moves the boundary. The model emits plain, typed JSON — no coordinates, no DSL to typo:
{
  "type": "flowchart",
  "nodes": [
    { "id": "spec", "label": "Typed JSON" },
    { "id": "engine", "label": "Layout engine" },
    { "id": "out", "label": "SVG / PNG" }
  ],
  "edges": [
    { "source": "spec", "target": "engine" },
    { "source": "engine", "target": "out" }
  ]
}
Then a real layout engine (ELK for graphs, d3 for data) computes positions and routing, and the SVG is rasterized to PNG natively in Rust (resvg). Three properties hold up no matter how good models get:
- Errors are fixable, not fatal. The JSON is checked against a strict schema before
anything renders. Malformed model output comes back as a precise, fixable error
(
edges[2].target references unknown node) that the agent corrects on the next turn — instead of a hard parse error that kills the whole render, the way a DSL like Mermaid does on one typo. - No browser in the stack. Layout and rasterization are native — no DOM, no Puppeteer, no Chromium. It deploys to a Lambda, a CI job, or an agent loop as an ordinary Node dependency.
- Cheap and intact at scale. Hand-drawing a large diagram is thousands of coordinate tokens — slow, and liable to blow the model's output limit and truncate. Your model emits compact JSON; the geometry is generated deterministically.
And because the JSON is the source of truth, the diagram stays editable data — diff it, change one node, re-theme, re-render — instead of a one-shot picture you regenerate from scratch each time.
What you get out
- SVG, high-res PNG, and React Flow JSON from a single call.
- 18 diagram types: architecture (nested VPCs/clusters), sequence, ERD (crow's-foot), UML class, state machines, flowcharts, Gantt, timelines, Sankey, Git trees, mindmaps, C4, pie, quadrant, kanban, user journeys, treemaps, and a freeform canvas.
- Theming, any Google Font, FontAwesome icons, and a hand-drawn sketch style.
How to use it
Three surfaces, same engine underneath.
MCP server — add it to Claude Code / Cursor / Claude Desktop in 30 seconds, no install:
claude mcp add glyphic -- npx -y @glyphicjs/mcp-server
Then just ask: "Draw an ERD for a blog with users, posts, and comments." The model emits the JSON, calls the tool, and the diagram appears.
Library:
npm install @glyphicjs/core @glyphicjs/schema
import { processDiagram } from "@glyphicjs/core";
import { writeFileSync } from "node:fs";

const result = await processDiagram({
  type: "architecture",
  title: "Web App",
  nodes: [
    { id: "web", label: "Web App", shape: "rounded", icon: "fab-react" },
    { id: "api", label: "API", shape: "hexagon", icon: "fas-bolt" },
    { id: "db", label: "PostgreSQL", shape: "database", icon: "fas-database" },
  ],
  edges: [
    { source: "web", target: "api", label: "REST" },
    { source: "api", target: "db", label: "SQL" },
  ],
});

writeFileSync("diagram.png", result.png);   // high-res PNG
writeFileSync("diagram.svg", result.svg);   // scalable SVG
console.log(result.reactFlow);              // interactive React Flow JSON
Self-hosted HTTP API — wrap the exact same engine behind your own endpoint so your product can generate diagrams without shipping the library to every client.
License, plainly
The schema and MCP server are MIT. The core engine is FSL-1.1: use, modify, and self-host it freely — the only restriction is you can't resell it as a competing hosted service, and it converts to Apache-2.0 after two years. It's source-available with a delayed open license, not OSI-approved from day one, and I'd rather say that than overclaim.
Try it
- Playground (no sign-in): glyphic.web.app/generate
- Repo: github.com/MS-Teja/Glyphic
- Curious whether the before/after above is a fair test? I wrote up the method: Is the AI-diagram comparison fair?
If you're building agents, pipelines, or a product that needs diagrams, I'd love your feedback — and a star helps.